使用 Promethues 收集 Docker 性能指标
只讲如何在 Linux 下配置 Prometheus。 其他操作系统,直接看 原文 。其实也没什么也看的
Prometheus 是一个开源监控和报警工具。可以将 Docker 作为其监控目标。本文将启动一个 Prometheus 容器,并兼容 Docker 实例。
警告:本文中所有可用的指标和其名字都可能在将来的版本中发生变化。
目前,你只能监控 Docker 本身,而不能监控 Docker 容器中的程序。
环境信息
#  操作系统版本
Kernel Version: 4.4.0-93-generic
Operating System: Ubuntu 16.04.3 LTS

# Docker 版本
Server Version: 17.09.0-ce

# prometheus 版本
prometheus, version 1.8.1 (branch: HEAD, revision: 3a7c51ab70fc7615cd318204d3aa7c078b7c5b20)
  build user:       root@ab78fb101775
  build date:       20171023-15:50:57
  go version:       go1.9.1
配置 Docker
将 Docker daemon 配置为 Prometheus 的目标,你需要指定 metrics-address。当然最为推荐的方法就配置 /etc/docker/daemon.json。 注意 json 文件格式。
{
  "metrics-addr" : "127.0.0.1:9323",
  "experimental" : true
}
加载 dockerd 配置
$ sudo kill -SIGHUP $(pidof dockerd)
现在 Docker 在 9323 端口上公开 Prometheu-兼容指标。
配置和启动 Prometheus
本例中, Prometheus 将通过 Docker 容器提供服务。
将下述配置文件保存到 /tmp/prometheus.yml 中
# my global config
global:
  scrape_interval:     15s # Set the scrape interval to every 15 seconds. Default is every 1 minute.
  evaluation_interval: 15s # Evaluate rules every 15 seconds. The default is every 1 minute.
  # scrape_timeout is set to the global default (10s).

  # Attach these labels to any time series or alerts when communicating with
  # external systems (federation, remote storage, Alertmanager).
  external_labels:
      monitor: 'codelab-monitor'

# Load rules once and periodically evaluate them according to the global 'evaluation_interval'.
rule_files:
  # - "first.rules"
  # - "second.rules"

# A scrape configuration containing exactly one endpoint to scrape:
# Here it's Prometheus itself.
scrape_configs:
  # The job name is added as a label `job=<job_name>` to any timeseries scraped from this config.
  - job_name: 'prometheus'

    # metrics_path defaults to '/metrics'
    # scheme defaults to 'http'.

    static_configs:
      - targets: ['localhost:9090']

  - job_name: 'docker'
         # metrics_path defaults to '/metrics'
         # scheme defaults to 'http'.

    static_configs:
      - targets: ['localhost:9323']
启动一个 单副本 的 Promethues 服务
$ docker service create --replicas 1 --name my-prometheus \
    --mount type=bind,source=/tmp/prometheus.yml,destination=/etc/prometheus/prometheus.yml \
    --publish 9090:9090/tcp \
    prom/prometheus
注意: 如果你的 Docker Host 没有加入到集群中,系统会提示你先
docker swarm init
通过 web 页面访问查看结果
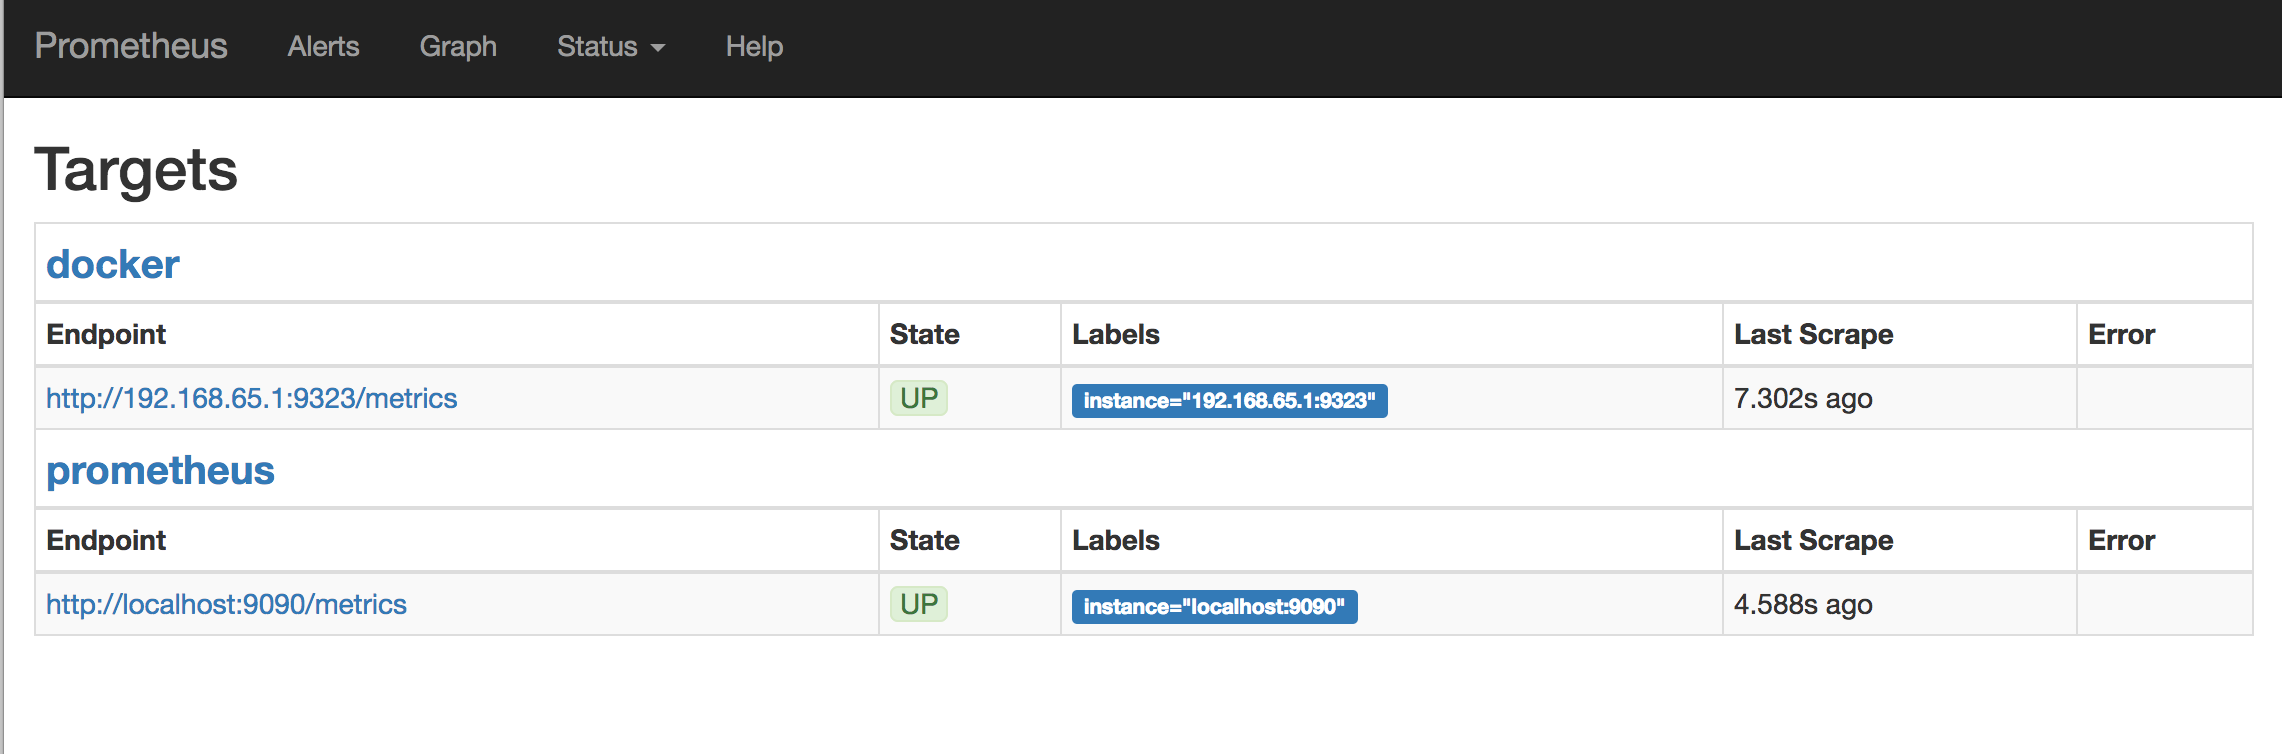
使用 prometheus
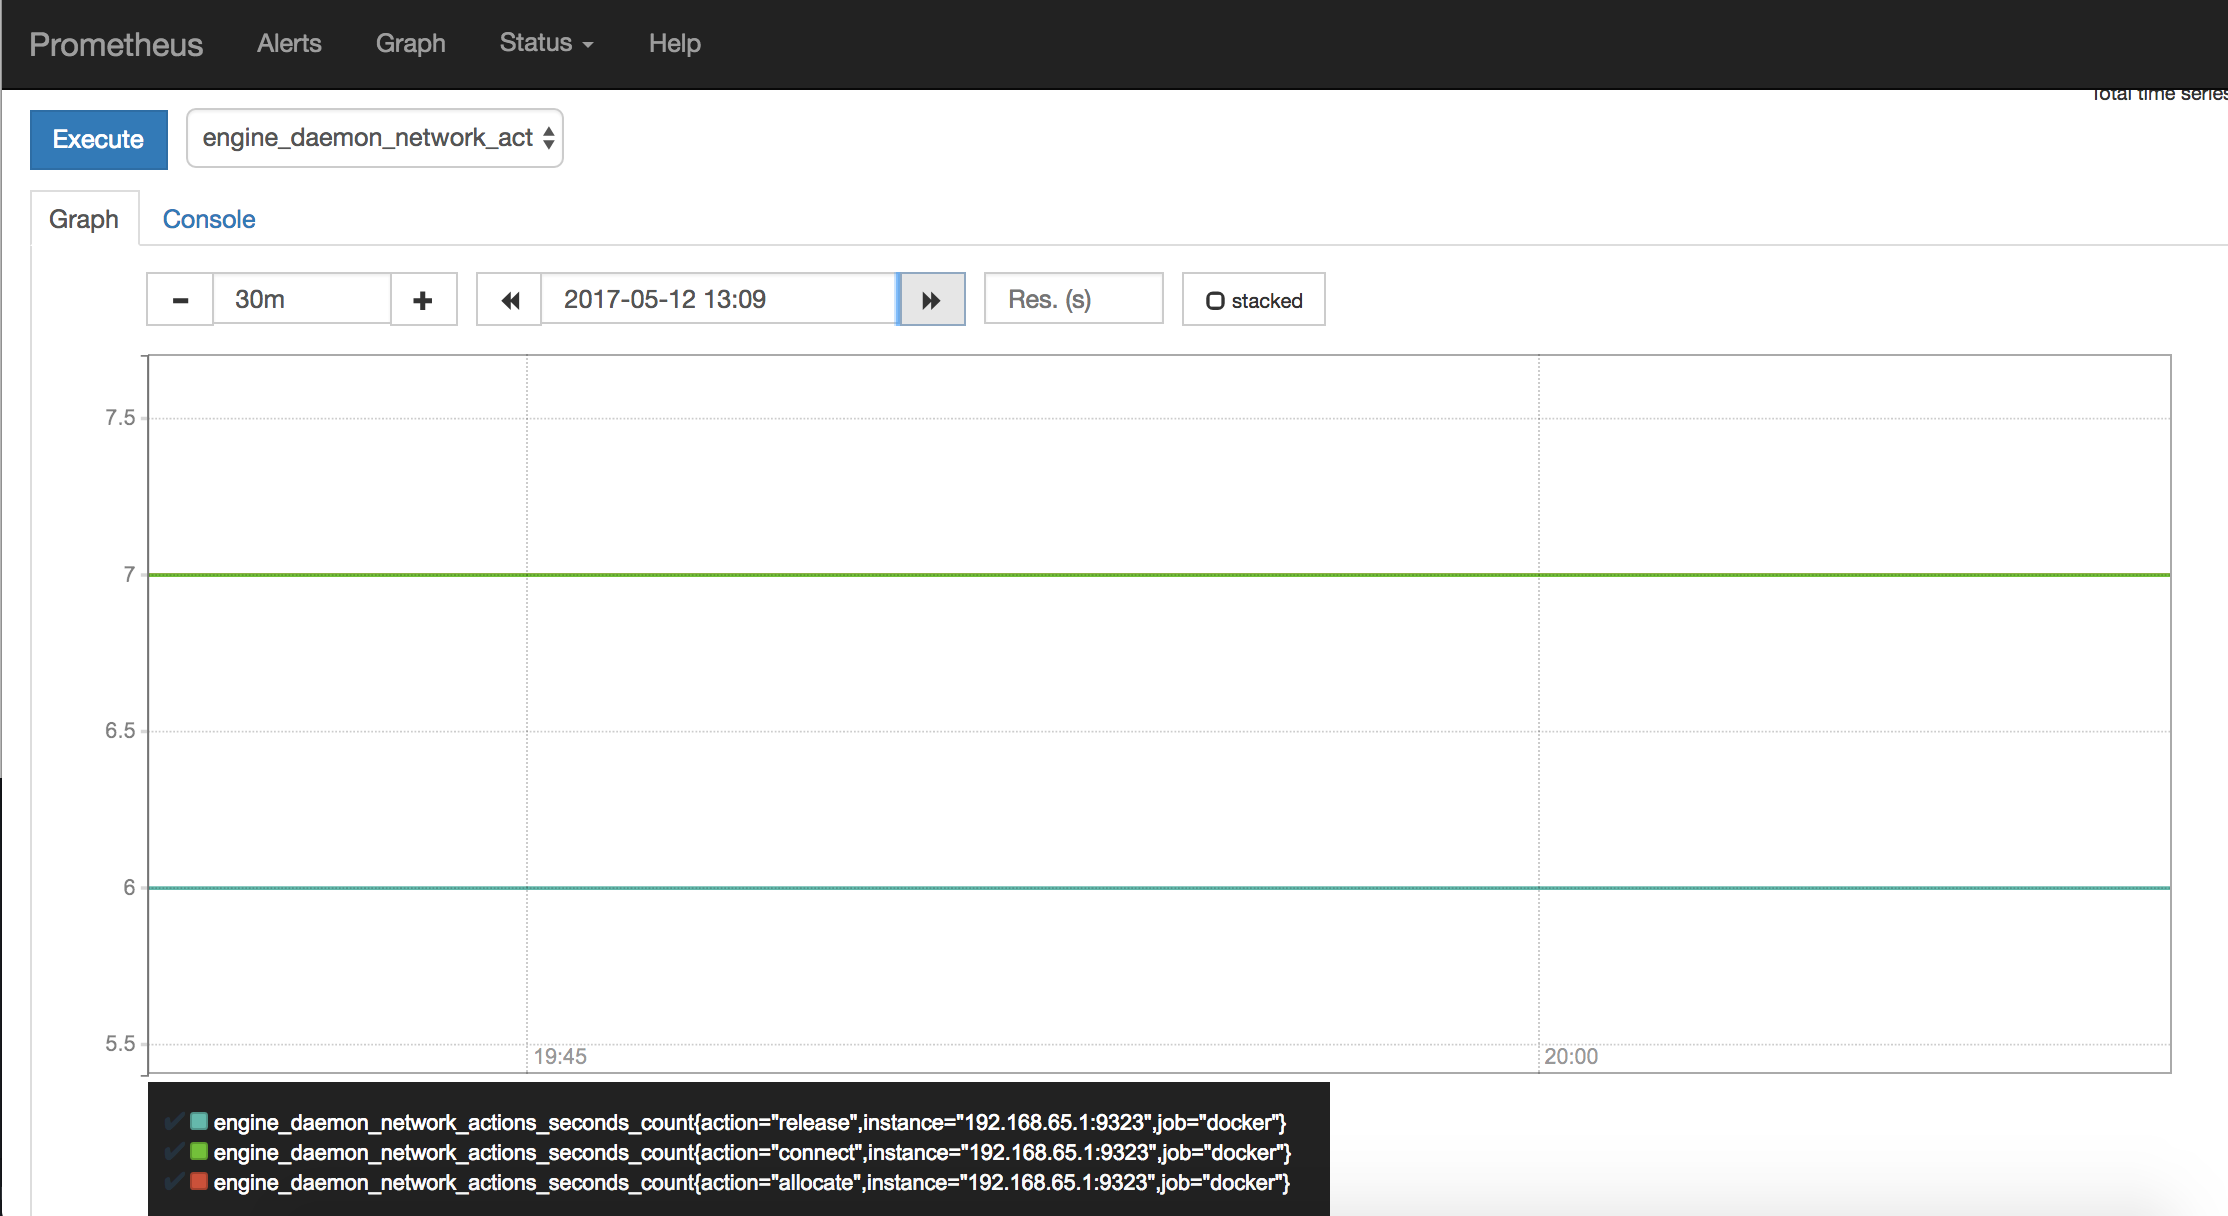
点击 Graphs , 在 下拉菜单 中选择一个 指标参数 , 点击 Execute。
屏幕上就会绘制所选择的监控图。
为了让监控图看起来更有趣一个点, 创建一个 10 个副本的服务,不停的 ping 。
$ docker service create \
  --replicas 10 \
  --name ping_service \
  alpine ping docker.com
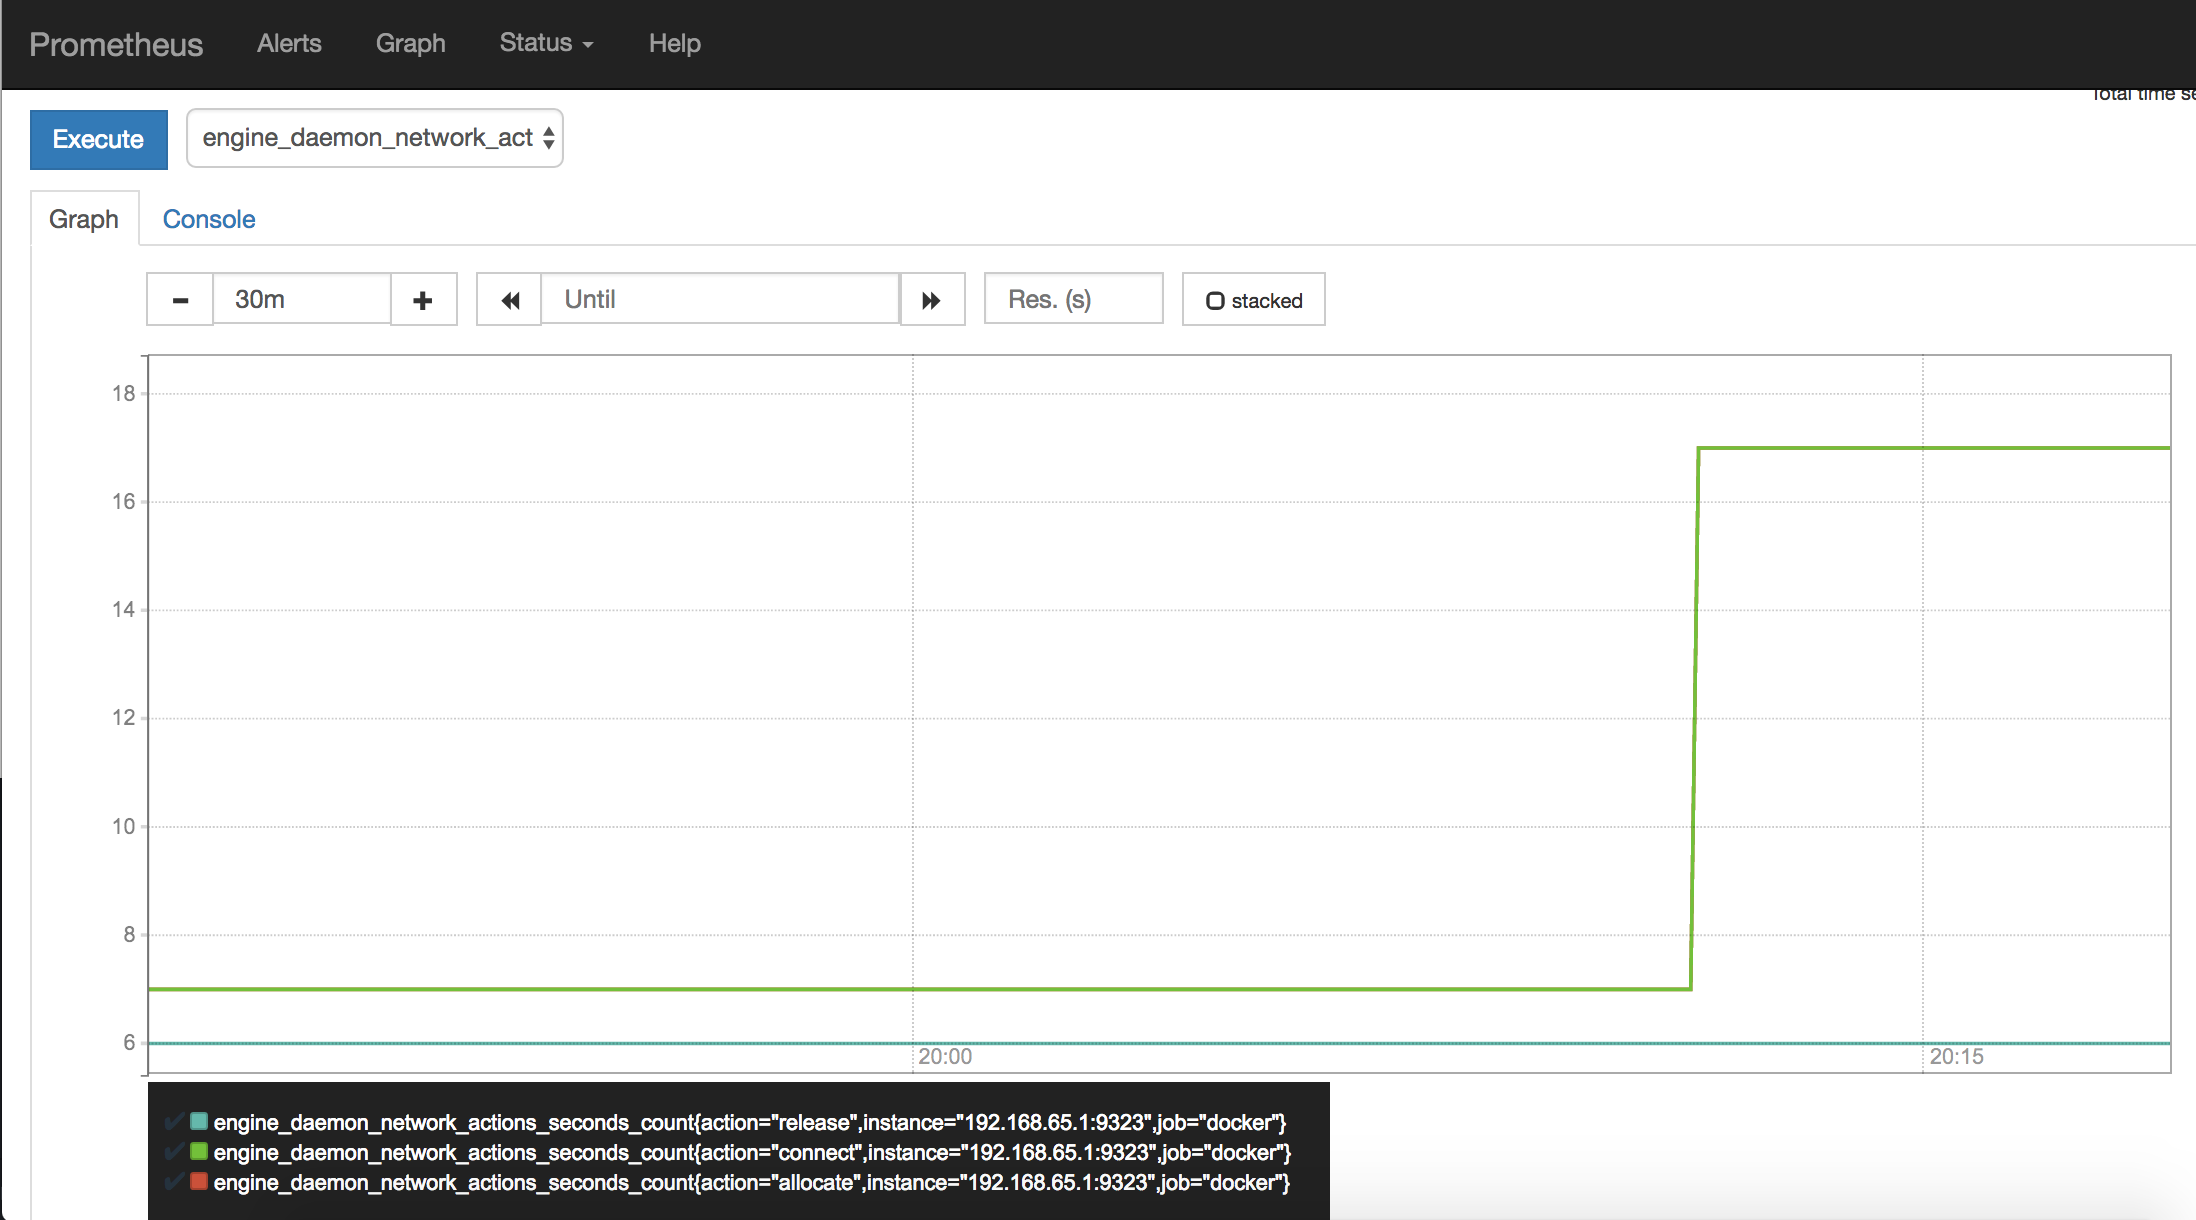
观察完成后,停止并删除 ping_service。
$ docker service rm pingservice
等几分钟后,你应该开可以看到监控图又回到了空闲级别。
实验说明
daemon.json中的配置的metrics-address指标,在我的监控图中报错
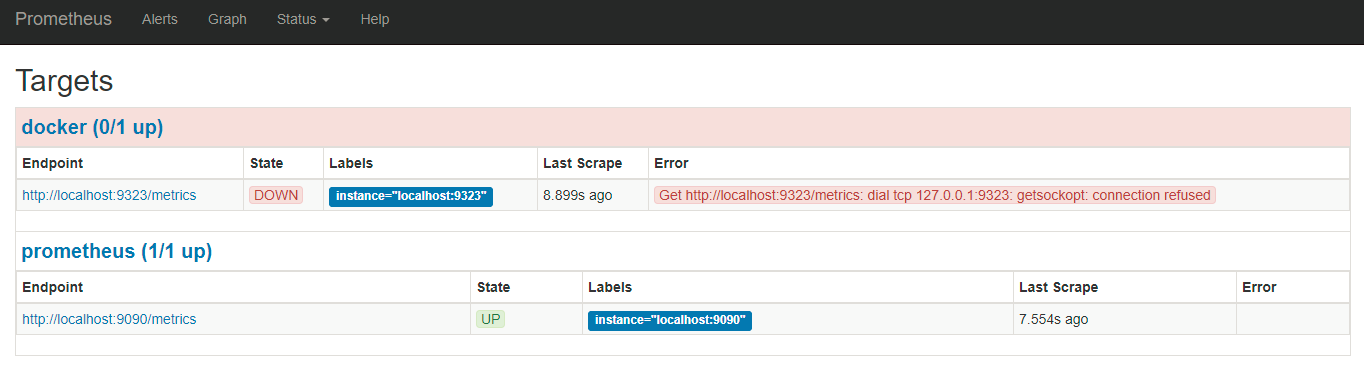
可能正如文章开头所言,监控的 metrics 已经失效了。
- Prometheus 中 Graph 下拉菜单中的监控项目名称与官网文档中的不一样。通过本文,可以初步搭建一个监控。
下一步
访问 Promethues 获取更多信息。